Local Search Summit – Day 3
That’s a wrap for Day 3 and our Local Search Summit is now complete! Our last day included talks on reputation management, Local Services Ads, LinkedIn partnerships, analytics, link building, spam-fighting and more. Today we are shining a spotlight on building strong location landing pages and how to level up your analytics. If you missed Day 1 & Day 2 most definitely go back and visit those posts after you finished here.
#WLSS Day 3 Talk Showcase:
- Vibranium and Other Elements of Landing Pages that Actually Convert – Amanda Jordan
- Level Up Your Analytics – Dana DiTomaso
Get Video Access to Local Search Summit 2021/2020
Want to deepen your knowledge and learn new tactics and strategies to improve your rankings and conversions from local search? Then our Whitespark Local Search Summit video bundle was made for you! For $199USD you will get access to all of the talks from 2021 and 2020.

Amanda Jordan(Locomotive Agency)
Vibranium and Other Elements of Landing Pages that Actually Convert
Your landing pages should be really strong like vibranium, but most local landing pages are presenting more like tin. They are text heavy or light, don’t display trust signals or reviews, it’s time to put your best foot forward and start converting.
- Build Trust
- Build Interest
- Start Converting
If someone is looking at clicking on your GMB listing to get to your website, they’re pretty close to the point where they are going to convert and become a lead for someone. Be that someone! Let’s dive into how to make an epic local landing page.
Common Problems
- Low visibility
- Low conversion
Start With the Basics
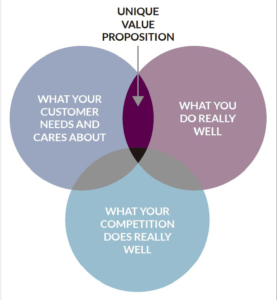
Unique Content with Unique Value Proposition (UVP) – You hear it all the time with local landing pages but don’t see it enough. UVP = What your customer needs and cares about, what you do really well, why customers should choose you.
Local Information:
- Name
- Address
- Phone Number
- Hours of Operation
- Local Schema
- City and Street in Headers

Site Navigation & URL Structure
Be logical and include some location information in the URL.
- Domain.com/location/state/city
- Domain.com/areas-served/city
- Domain.com/locations/city/street
Technical is part of the basics. If your local landing page is not mobile-friendly, fast, or indexable, nothing else matters especially if you are having visibility issues.
But basic elements are not enough. If you’re depending on these for your location landing pages, you are not going to get the results you’re looking for.
Make your location landing page vibranium strong with:
- Calls-to-Action (CTAs)
- Trust Factors
- Reviews & Reputation
CTAs – You can’t turn a site visitor into a lead without calls-to-action and conversion opportunities. Include these above the fold and near reviews and testimonials to improve their impact.
💭Did you know? CTAs come in all shapes and sizes! — @amandatjordan #WLSS
— Elizabeth Linder (@Its_Liz_Linder) September 17, 2020
It doesn't always have to be a "book an appointment" button, it could be a phone number at the top or a contact form in the middle of the page.
What works best for your business?⭐️
Your CTA could be your phone number displayed at the top of the page, a contact from in the middle of the page, or a section at the bottom of the page reminding users why they should choose you and what to do next.
Trust & Reputation Signals
- Awards and accolades
- Testimonials
- Online ratings
- Build confidence
This slide is so good "It's important to have trust signals on these pages." #WLSS @amandatjordan pic.twitter.com/RSbGRj11MR
— Jess but 6 feet away (@jessthebp) September 17, 2020
There are very few companies that are actually incorporating all the elements as part of their strategy for local landing pages.
Customer reviews and testimonials are considered an extremely important factor for converting PPC landing pages and translate over to location landing pages very well.
Pages can see as much as a 33% improvement in conversion just by adding reviews. Amp up your reviews and testimonials by showing the value (when possible) that your company brought to that client.
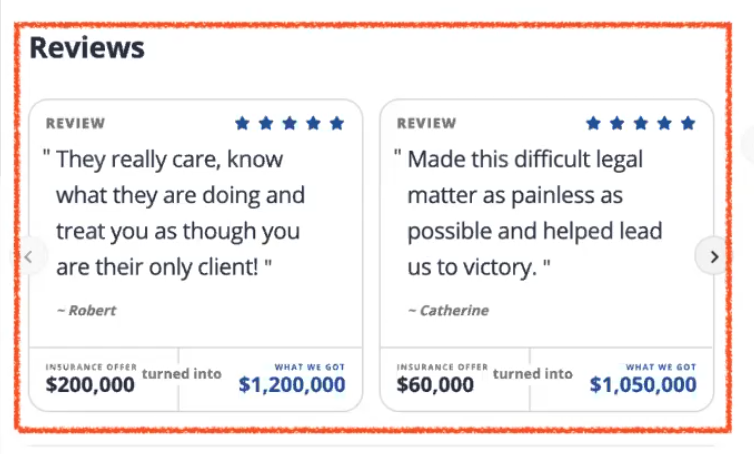
Building Confidence – evidence of the value of your product/service helps instill confidence in visitors
- Videos of the process
- Before and after images
- Photo gallery
Give customers all the information they need to make a buying decision on your local landing page. Putting all these elements together works!

Now go test, test, and test again. You won’t know what works best for your business unless you try and test.

Dana DiTomaso (KickPoint)
Level Up Your Analytics
A lot of people don’t feel comfortable with analytics because analytics tools are hard to understand. Also, the names of things seem simple but when you start to peel back the layers, it becomes more complicated. Many people think they’re reporting on one thing, but as they dig deeper into their reports they find they are not actually reporting on it or not doing it well.
In order to be a responsible marketer, you really need to have a license for Google Analytics. Your job is to understand and communicate the limitations of the product. Analytics can’t measure everything and it can measure less and less than it used to be able to. If you don’t know how metrics are calculated, it’s likely that you will be saying incorrect things to your boss or clients. Arming yourself with knowledge is the best way to do good reporting and analytics.
- Lesson 1 of Stats: Understand where the data comes from. Stats are raw unprocessed data, but with analytics you’re rarely ever looking at the raw data.
- Lesson 2 of Stats: Torture the data long enough and you’ll get it to say anything.
Google Analytics
Users
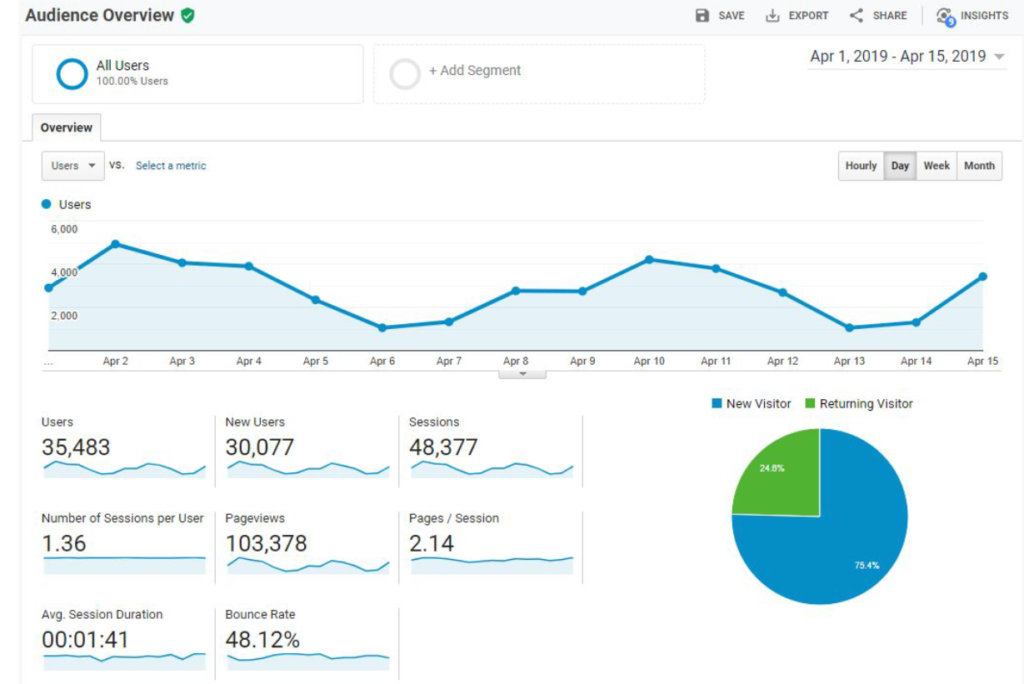
Quite possibly the most misunderstood metric in all of Google Analytics is Users. What is a user? Someone who has been given a client ID (CID) by Google, it is a unique number given to you and it may or may not be shared across devices.
If you’re on Firefox or Safari you may have one client ID one day and then a completely different ID another day.
New uses can be returning users, if they returned in the same time period.
For example: I visit your website on August 1 and then again visit August 2, I was a new user on the 1st, a returning user on the 2nd, and if I come back on August 3rd I’ll be counted as just a user. So am I three users or one? Well, Google doesn’t really know. When you see All Users, New Uses, and Returning Users those figures are never going to match because Google is counting users multiple times depending on their behaviour. And on top of all this, it’s just for the current reporting period you’ve selected, so it will continue to change as you change your data.
You should never report on new users vs returning users.
me: Look at all our users this month!@danaditomaso:#WLSS pic.twitter.com/l73kMvc4G9
— Kim Doughty (@howdydoughty) September 17, 2020
Sessions
Sessions timeout after 30 minutes. Let’s say you visit the KickPoint website and you go check out a blog post and you are halfway through reading it, you decide to leave and have some lunch, you come back after 31 minutes and you open up the website again, now you are a new session. 1 user with 2 sessions.
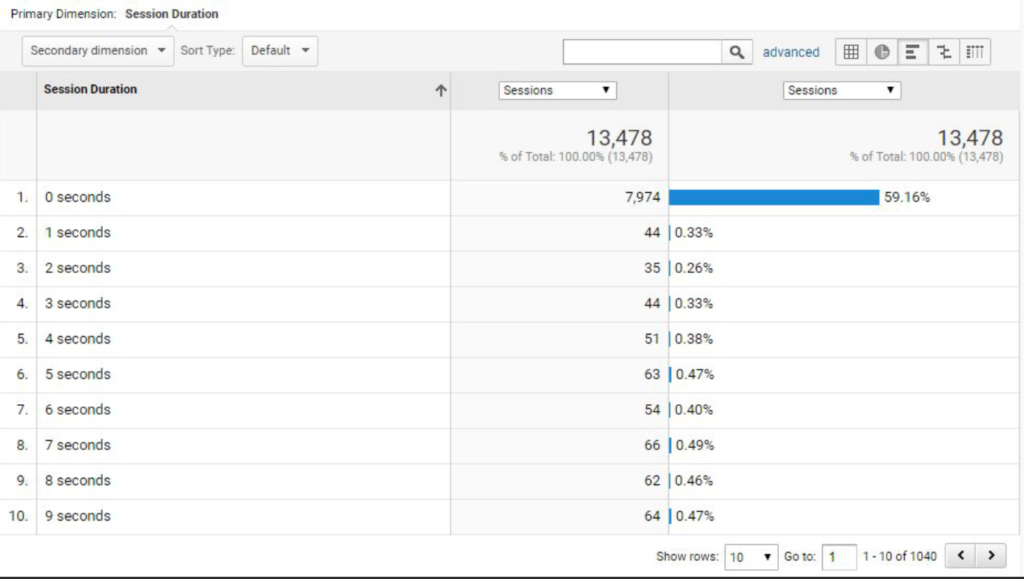
Does that mean you had two unique pageviews? Why, indeed it does. In fact if you just came back and you left it open for a long time you would end up with something like this:
This looks like 59% of sessions on this page have a 0 second duration, how does that even work? It works because people are tab hoarders. With every open tab it’s sending a 0 second duration pageview, and every time you reactivate your browser it wakes up and sends a 0 second pageview to each tab to make sure that the page exists.
That means you’re going to have a lot of recorded 0 second pageviews that you’ve been reporting on, unless you’ve gone in to drill down on real pageviews. If you look at that image above again, those 59% of page views or 7,974 views should be removed from the reported pageviews total to get the actual number of people who looked at the page.
Bounce Rate
Bounce rate is terrible – it’s just the worst thing you could possibly report on.
Why is bounce rate awful? It can lie, by default it’s based on the simplest of things. If someone spent 8 years on a page but never actually went to a second page then they would be counted as a bounced visit with 0 second of duration. Even thought they’ve been looking at this page for so long. While you can make bounce rate better using Google Tag Manager you can also easily manipulate it.
The magic happens in Google Tag Manager when you create a non-interaction event.
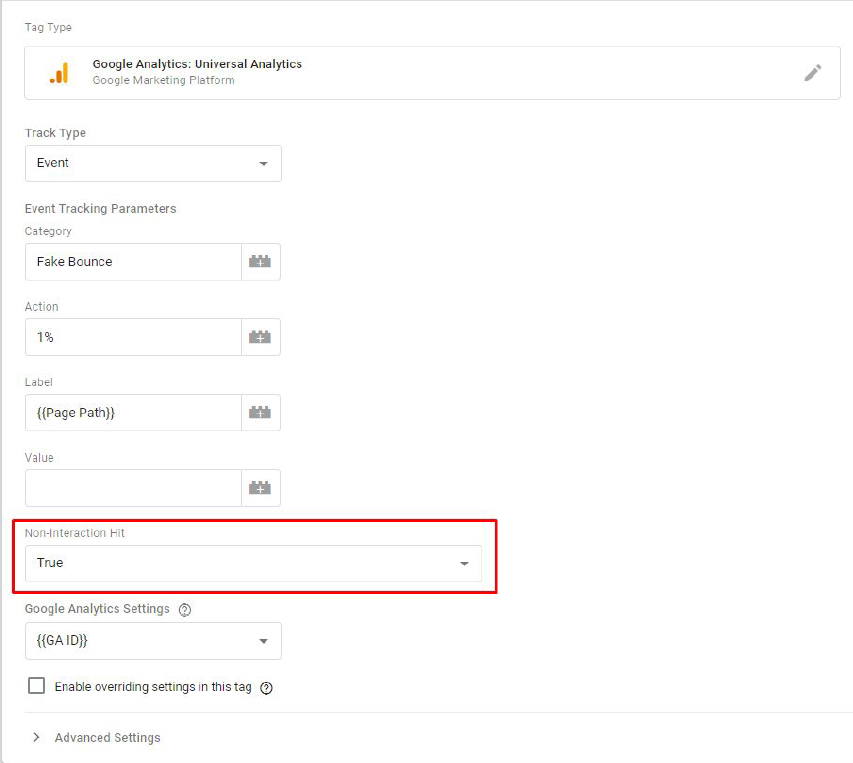
An interaction event means it is no longer a bounce. By default, for example, someone scrolling down to 1% of the page could be recorded as an event in Google Analytics, but you can say it’s a non-interaction event so that means it doesn’t change anything with regards to bounce rate. In this way, you are not manipulating your reporting results.
Should you use Google Tag Manager? Yes, of course.
Cool things you can do with Google Tag Manager
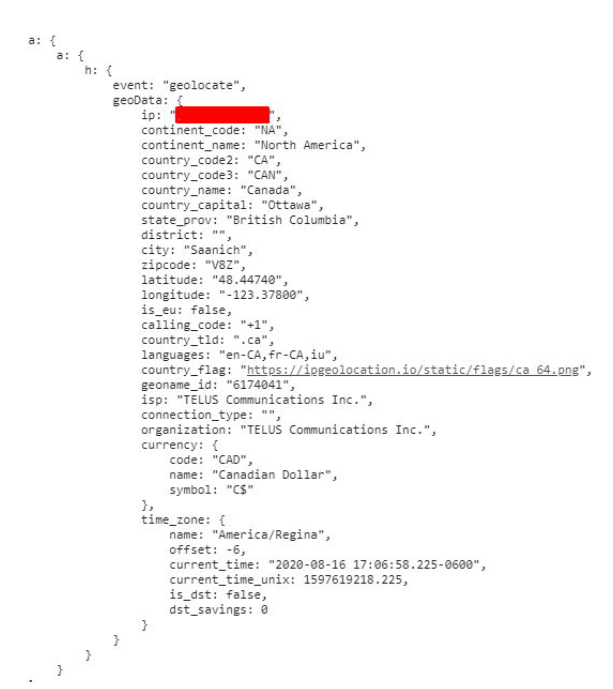
Fetch IP Geolocation Data
Simo Ahava is a Google Tag Manager Wizard and walks you through how to set this up. Check out the instructions on how you can implement the steps to get geo-location data.
What you can do with this data is record the zip codes or postal codes of users and then make a segment of people from certain postal codes of zip codes that are actually the service areas of your business. You can use that data for popular blog posts to see if you’re getting geographically likely to use/hire your business/client’s business, based on the areas you serve or if you’re just getting traffic for the sake of traffic.
What else should you do with Google Tag Manager?
Use events to record form fills.
Ye olden days of the internet you would fill out a form and go to a thank you page, but you end up sending people to a thank you page and they end up hoarding them in their browser forever and you end up with extra sessions in your reporting, and goals being recorded that aren’t actually goals. Destination goals are horrible for a number of different reasons. If you have form fills go to GA and it’s already built into Tag Manager then you can choose to record it as a goal in Tag Manager.
@danaditomaso helping answer a long-standing question at my agency. Maybe it's time to start using GTM to track webform leads? #wlss pic.twitter.com/pXOM1iWpJa
— Jay Stalls (@JayStalls) September 17, 2020
Use the same “trigger” for multiple destinations.
For example you run Facebook ads and you want to record conversions from Facebook every time someone fills out a form. It’s triggering based on the exact same metrics with the same event with no additional code needed.
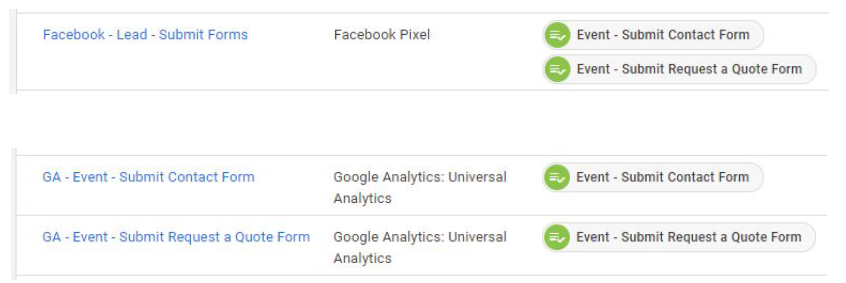
Get a better understanding of how visitors use your site.
You can record events for things like, does anyone see calls-to-action? Did your newsletter form pop-up? And what percentage of people that saw the form actually filled in the form?
The other problem with GA is that it records conversions based on sessions, not users. Last time Dana checked, users buy stuff not sessions. 🤣
Here’s some examples of stuff you could include:
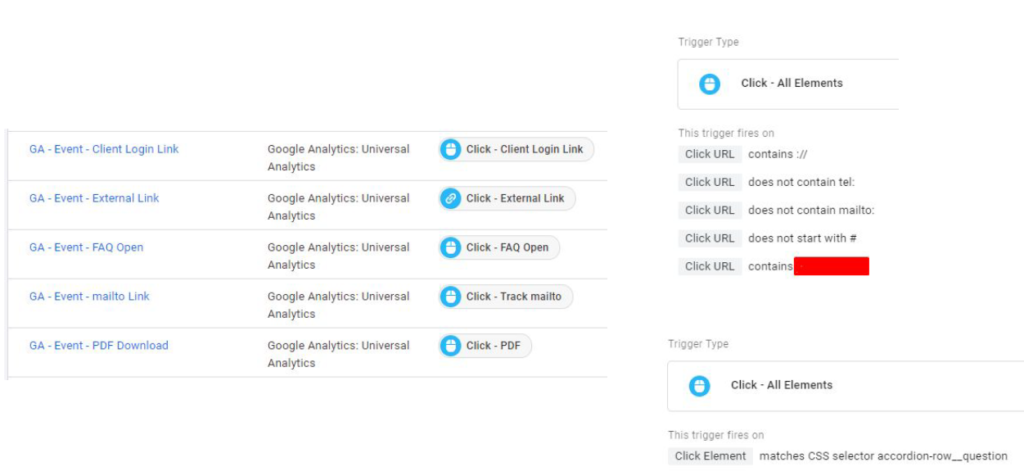
Link to an intranet, link to content, accordions with FAQ items, clicks on mailto links, or clicks on a PDF download link. All of these things are built in.
How to Track Featured Snippets
In Chrome, if you click on a link from featured snippets you will end up on that website and the featured snippet is highlighted in yellow.
Because Google includes the information in the URL, you can grab it and save it in GA and know that people clicked it to get to your website. Here’s a walk through from Brodie Clark on how to implement this:
Content Consumption – Go Beyond Pageviews
You want to know if people are reading your content. The content consumption metric measures how long it will take someone to read the content and where the content ended; if both these things happen, the person is on the page long enough and they went to the bottom of the page where the content ends, then it’s assumed that they consumed the content. This helps you see if anyone is actually reading your content or what content is the most popular and being read by people.
Pulling it All Together Into a Report
Of course, you need to pull this together into a report. What’s the point of data if you don’t do anything with it? When it comes to reporting, not everyone is going to need to know what you need to know. You can tell at a glance if you’re on the right path when:
- Your client has a goal and you’re including that information in your reporting.
- Say what percentage you are towards that goal.
- Include a projection.
- You shouldn’t have to explain the report.
- The report should stand on its own and not require additional explanation.
- Shorter is better.
- The report can be used for years to come.
- If you look at the report in the future, would you know what’s going on? You should be able to.
- The report has room to breathe.
- Who is going to be seeing it? Don’t cram information in there. Leave out information that doesn’t help.
A Few Basics For Beginners:
Tags and Triggers work together. Triggers are something that happened (someone played a video, someone filled out a form) and tag manager is listening for this. The tag is what do I do now? The tag is sending the information to GA or Facebook.
Set up a fake Google account to play around and do things and test the two tools out. Have lots of containers and test, test, test. This is the best way to learn.


